
Pure Java agent by default
The agent instruments selected methods through class loading. It loads no native libraries unless you explicitly run a profiling action.
Automatic Production Profiling
Deep profiling captures in production are risky, but sometimes necessary. jvmguard brings them under control: every capture is authorized and audited, whether it is triggered by a person, a monitoring alert, or an agent.
Open source under the Apache License 2.0.
The agent instruments selected methods through class loading. It loads no native libraries unless you explicitly run a profiling action.
Set a threshold on a telemetry or a transaction. When it is crossed, jvmguard runs the actions you configured: record JFR, take a heap or thread dump, write to the inbox, send an email, or call a webhook. You compose the response in the UI.
Lightweight telemetries and the transactions you define provide the signals that trigger a deep capture. Steady-state overhead stays close to zero.
The agent reads MBeans in process. You can inspect and operate on MBeans without exposing a JMX connector server to the network.
Organize hundreds of JVMs into hierarchical groups. Configuration is inherited, so a group applies to every JVM under it and new JVMs need no up-front setup.
Recorded data is aggregated to larger intervals as it ages. Transactions can be discarded after a threshold you set.
Install on Windows, macOS, or Linux. All recorded data stays local with no outbound cloud dependency, so the server can run on your own infrastructure, including air-gapped networks.
Start a capture from the UI for any connected JVM. The capture lands in the inbox.
A threshold you set on a telemetry or transaction fires a capture automatically: a JFR recording, a heap dump, or a thread dump for the affected JVM.
An AI agent starts a capture through the MCP server. Scope limits and an audit record of every operation keep that access accountable.
Captures are standard files. JFR recordings and HPROF heap dumps open in JProfiler, JDK Mission Control, or Eclipse MAT.
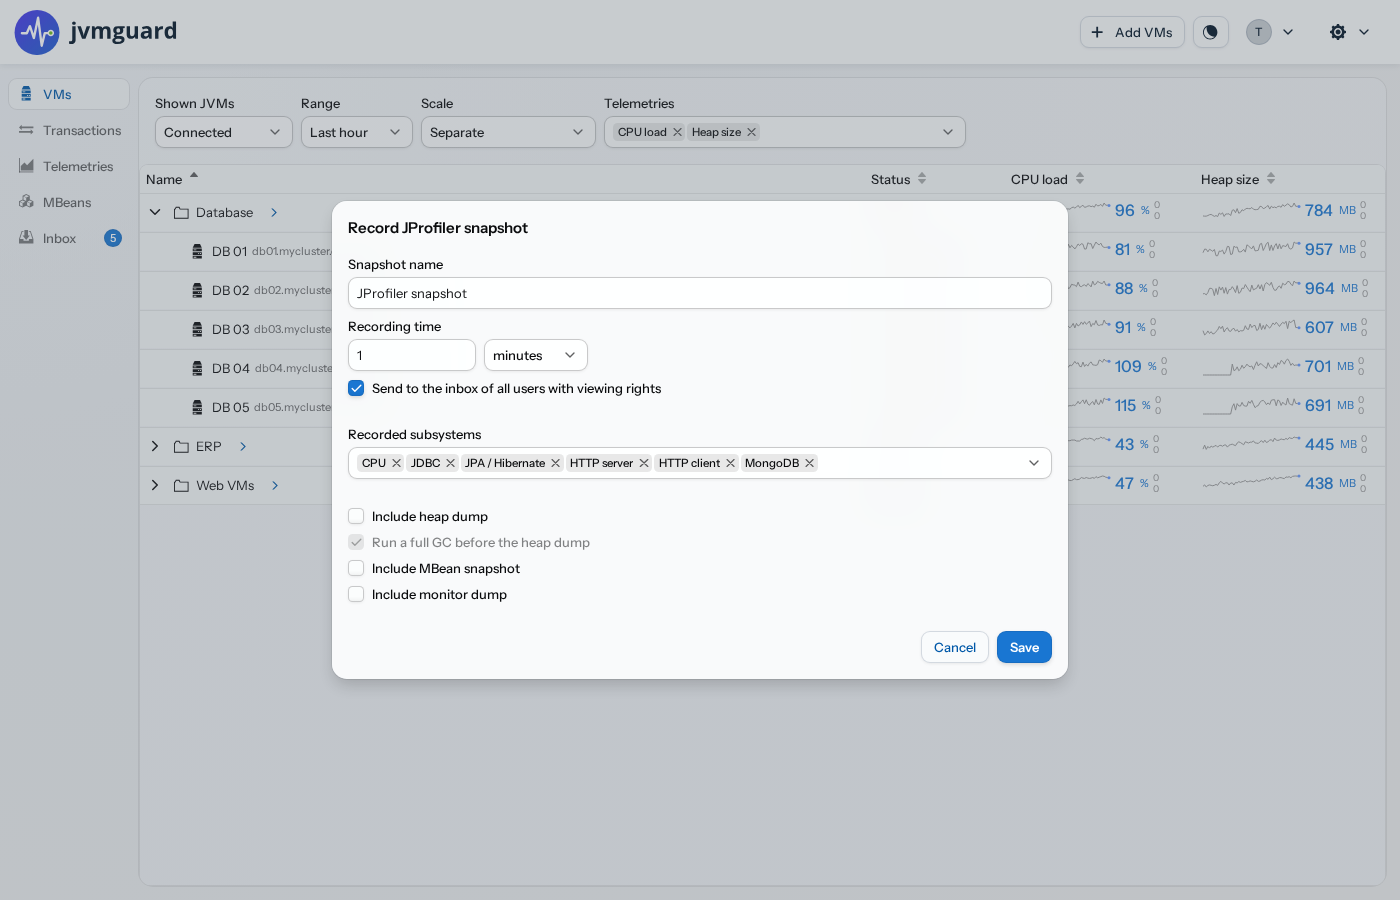
For the deepest analysis, jvmguard can record a JProfiler snapshot, which breaks down subsystems such as JDBC, JPA, MongoDB, HTTP and gRPC calls, Kafka, and LLM invocations.
jvmguard includes an MCP server. An AI agent connects to it to discover the JVM fleet, read telemetries, transactions, and MBeans, start a JFR recording or a heap or thread dump, and retrieve the capture. The same operations that the UI exposes are also available to an agent.
The direction is a supervised loop: an agent detects a problem, captures the right profile, and recommends a next step, with a person approving each capture. The guardrails that make this production-safe are the rate and overhead limits, and a full audit record of every agent operation.